





Stop Guessing Whether
Loyalty Is Working.
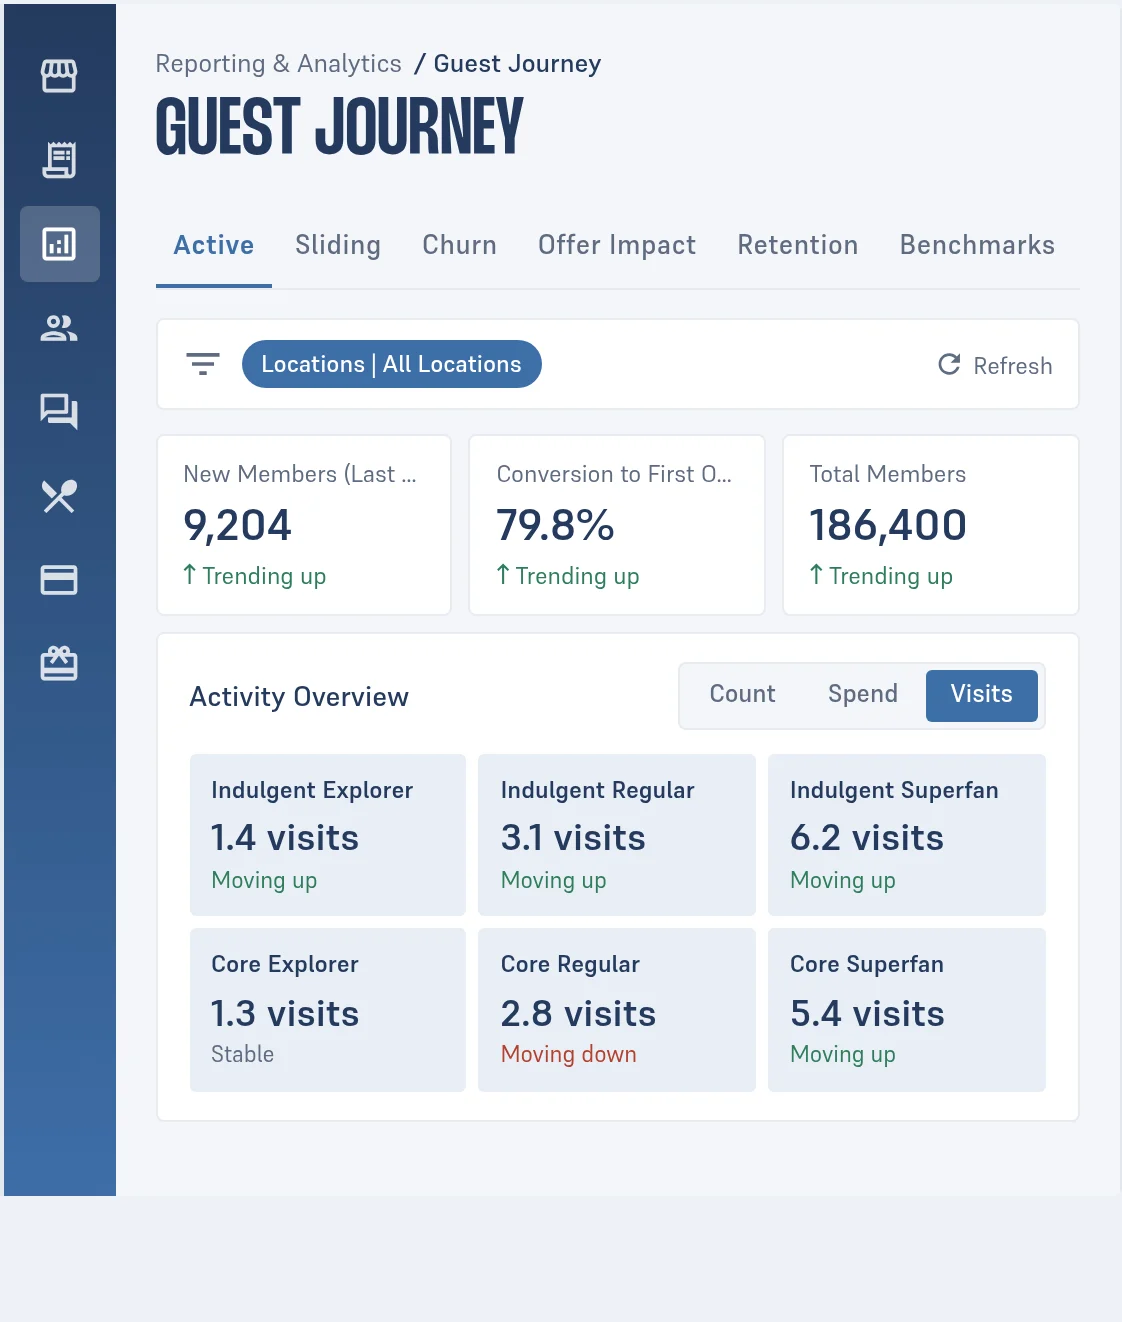
Six connected reports, from brand-wide performance down to a single offer, so you get a straight answer.
Book a demoYou have members.You have data.
But when someone asks whether loyalty is working, most teams have no quick answer, just scattered numbers.
Six Reports, One Story
Numbers show what happened. These show what it means and where to act next.
- Track growth, revenue share, and repeat visits
- Compare franchisee and location performance
- See which offers work and which fade
Set a Target, Don't Just Look at a Chart
A trend line shows where things stand today. A target turns it into something you're working toward.
- Set a goal on any location's trend
- Track progress against that goal over time
- Turn a report into a plan
Your Data, Ready for What's Next
Every answer raises a new question. Export any number and answer it yourself.
- Export any report as structured data
- Drop it into the AI tools your team uses
- Get answers without waiting on an analyst
Lowest Loyalty Average Check against the $41.36 total.
Memphis has the widest gap, $7.82. Start there with an add on offer.
Frequently
Asked Questions
Brand-wide numbers are limited to admins with full brand access. Anyone else sees only their permitted locations.
Yes. Filter by date range, compare to a prior period, and view by day, week, or month, depending on the report.
This compares a location against your own brand's other locations. Guest Journey's benchmarks compare your whole brand against similar restaurant concepts.
No. It's built to be read and acted on without one.
Signed-in members only. Guest checkout activity isn't included in offer performance reporting.
Know What Loyalty
Is Earning You.
Six connected reports, one straight answer.
Book a Demo