LOYALTY PULSE

Stop Guessing Whether
Loyalty Is Working.

Six connected reports, from brand-wide performance down to a single offer, so you get a straight answer.

Book a demo
WorkspaceQ’s Cafe
Loyalty PulseProgram health across members, locations, and offers.Updated 2 minutes ago
Brand Loyalty OverviewFranchisee Loyalty OverviewLocation Loyalty PerformanceLocation Loyalty TrendsLoyalty Offer PerformanceLoyalty Offer Trends
Date Range|Aug 1 to Aug 31Compare To|Jul 1 to Jul 31Locations|AllExportRefresh
Learn more about these Report fields
Total Members
24,806
+6.9%vs Jul
Active Members
7,532
+2.4%vs Jul
Activity Rate (All Members)
30.4%
+0.6%vs Jul
Deleted Accounts
34
-12.0%vs Jul
Loyalty Orders Net Sales
$770,826.32
+3.4%vs Jul
Contribution Rate (Loyalty Sales)
21.1%
+1.2%vs Jul
Loyalty Contribution (% of Orders)
19.9%
Loyalty Average Check
$41.36
+1.9%vs Jul
New Members
Signups, Aug 1 to Aug 31
1,204
new members
Organic Signups79566.0%
Referral Signups40934.0%
Members
Daily, Aug 1 to Aug 31
Table
8,0006,0004,0002,0000
ActiveSignups (cumulative)
Loyalty Account Orders
By channel, Aug 1 to Aug 31
18,637
loyalty orders
Scan 2 Pay7,45540.0%
In Store4,10022.0%
Web Ordering3,72720.0%
Mobile App3,35518.0%
Loyalty PulseProgram health across members, locations, and offers.Updated 2 minutes ago
Brand Loyalty OverviewFranchisee Loyalty OverviewLocation Loyalty PerformanceLocation Loyalty TrendsLoyalty Offer PerformanceLoyalty Offer Trends
Date Range|Aug 1 to Aug 31Compare To|Jul 1 to Jul 31Locations|AllExportRefresh
Learn more about these Report fields
Active members
7,532
+3.1%vs Jul
Activity rate
30.4%
+0.9%vs Jul
System activity rate
29.4%
-0.8%vs Jul
Contribution rate
21.1%
+1.2%vs Jul
System contribution rate
17.1%
+1.2%vs Jul
Members
Q’s Cafe active members, daily
Table
7,0007,1507,3007,4507,600Aug 1Aug 8Aug 15Aug 22Aug 29
Contribution Rate
Loyalty share of sales, daily
Table
0%8%15%23%30%Aug 1Aug 8Aug 15Aug 22Aug 29
Q’s CafeSystem
Loyalty PulseProgram health across members, locations, and offers.Updated 2 minutes ago
Brand Loyalty OverviewFranchisee Loyalty OverviewLocation Loyalty PerformanceLocation Loyalty TrendsLoyalty Offer PerformanceLoyalty Offer Trends
Date Range|Aug 1 to Aug 31Compare To|Jul 1 to Jul 31Locations|AllExportRefresh
Learn more about these Report fields
Loyalty earn orders
14,742
+4.6%vs Jul
Loyalty burn orders
3,895
+5.2%vs Jul
Loyalty orders net sales
$770,826.32
+3.4%vs Jul
Discount amount
$13,206.55
-0.9%vs Jul
Location NameActive MembersLoyalty Earn OrdersLoyalty Burn OrdersLoyalty Average CheckDiscount AmountUnique User Scan to Pay
Austin1,4822,914806$39.52$2,418.402,310
Austin - Catering20641288$111.28$618.90310
Boston1,3182,640712$36.53$2,190.602,081
Boston Catering18836674$102.96$540.25273
Fenway9941,880498$34.94$1,614.801,476
Memphis7421,406362$33.54$1,184.351,098
San Francisco1,1062,214596$42.51$2,042.701,745
Seattle8681,690441$39.26$1,506.401,323
St. Augustine6281,220318$35.75$1,090.15955
Total7,53214,7423,895$41.36$13,206.5511,571
Rows per page: 501–9 of 9
Loyalty PulseProgram health across members, locations, and offers.Updated 2 minutes ago
Brand Loyalty OverviewFranchisee Loyalty OverviewLocation Loyalty PerformanceLocation Loyalty TrendsLoyalty Offer PerformanceLoyalty Offer Trends
Granularity|DayDate Range|Aug 1 to Aug 31Data|Earn + BurnLocations|AllExportRefresh
Learn more about these Report fields
Active Members (Earn + Burn)
Members active for the first time in the month, by day. Top 5 locations by active members
Table
020406080Aug 1Aug 8Aug 15Aug 22Aug 29
AustinBostonSan FranciscoFenwaySeattleOther (4 locations)
Active members by day
Aug 1 to Aug 31, 2026
DayAustinBostonSan FranciscoFenwaySeattleMemphisSt. AugustineAustin - CateringBoston CateringAll Locations
Day 15451423730261976272
Day 25449433126261977262
Day 34030322521201765196
Day 44541282628191866217
Day 54336373227202165227
Day 64134342824221855211
Day 73935362928252176226
Day 85550363233252567269
Rows per page: 311–31 of 31
Loyalty PulseProgram health across members, locations, and offers.Updated 2 minutes ago
Brand Loyalty OverviewFranchisee Loyalty OverviewLocation Loyalty PerformanceLocation Loyalty TrendsLoyalty Offer PerformanceLoyalty Offer Trends
Date Range|Aug 1 to Aug 31Compare To|Jul 1 to Jul 31Locations|AllOffer|AllExportRefresh
Learn more about these Report fields
Loyalty Earn Orders
4,318
+3.1%vs Jul
Loyalty Burn Orders
1,206
+0.6%vs Jul
Loyalty Orders Net Sales
$92,418.40
+0.6%vs Jul
Discount Amount
$11,760.35
-1.7%vs Jul
Active Members
2,400
+0.5%vs Jul
Loyalty Offer NameActive MembersLoyalty Earn OrdersLoyalty Burn OrdersDiscount AmountLoyalty Average CheckUnique User Scan to Pay
BOGO - Classic———$2,146.20——
BOGO - qty———$1,018.60——
BTBT———$602.50——
Signup = 100 points free———$4,812.00——
125 pts, syrup, max $1.00———$618.00——
375 pts, drip coffee and tea———$1,569.80——
725 pts, hand crafted drinks———$993.25——
Double points on energy drinks———$0.00——
Total———$11,760.35——
Rows per page: 501–8 of 8
Loyalty PulseProgram health across members, locations, and offers.Updated 2 minutes ago
Brand Loyalty OverviewFranchisee Loyalty OverviewLocation Loyalty PerformanceLocation Loyalty TrendsLoyalty Offer PerformanceLoyalty Offer Trends
Granularity|DayDate Range|Aug 1 to Aug 31Data|Earn + BurnLocations|AllOffer|AllExportRefresh
Learn more about these Report fields
Redemptions
By day. Top 4 offers by redemptions
Table
01020304050Aug 1Aug 8Aug 15Aug 22Aug 29
Signup = 100 points free125 pts, syrup, max $1.00BOGO - Classic375 pts, drip coffee and teaOther (4 offers)
Redemptions by day
Aug 1 to Aug 31, 2026
DayBOGO - ClassicBOGO - qtyBTBTSignup = 100 points free125 pts, syrup, max $1.00375 pts, drip coffee and tea725 pts, hand crafted drinksDouble points on energy drinksAll Offers
Day 1196448241053119
Day 2187440231253112
Day 31253301793281
Day 41563341895393
Day 516533217104390
Day 613643919104297
Day 714533218105289
Day 8188444201253114
Rows per page: 311–31 of 31

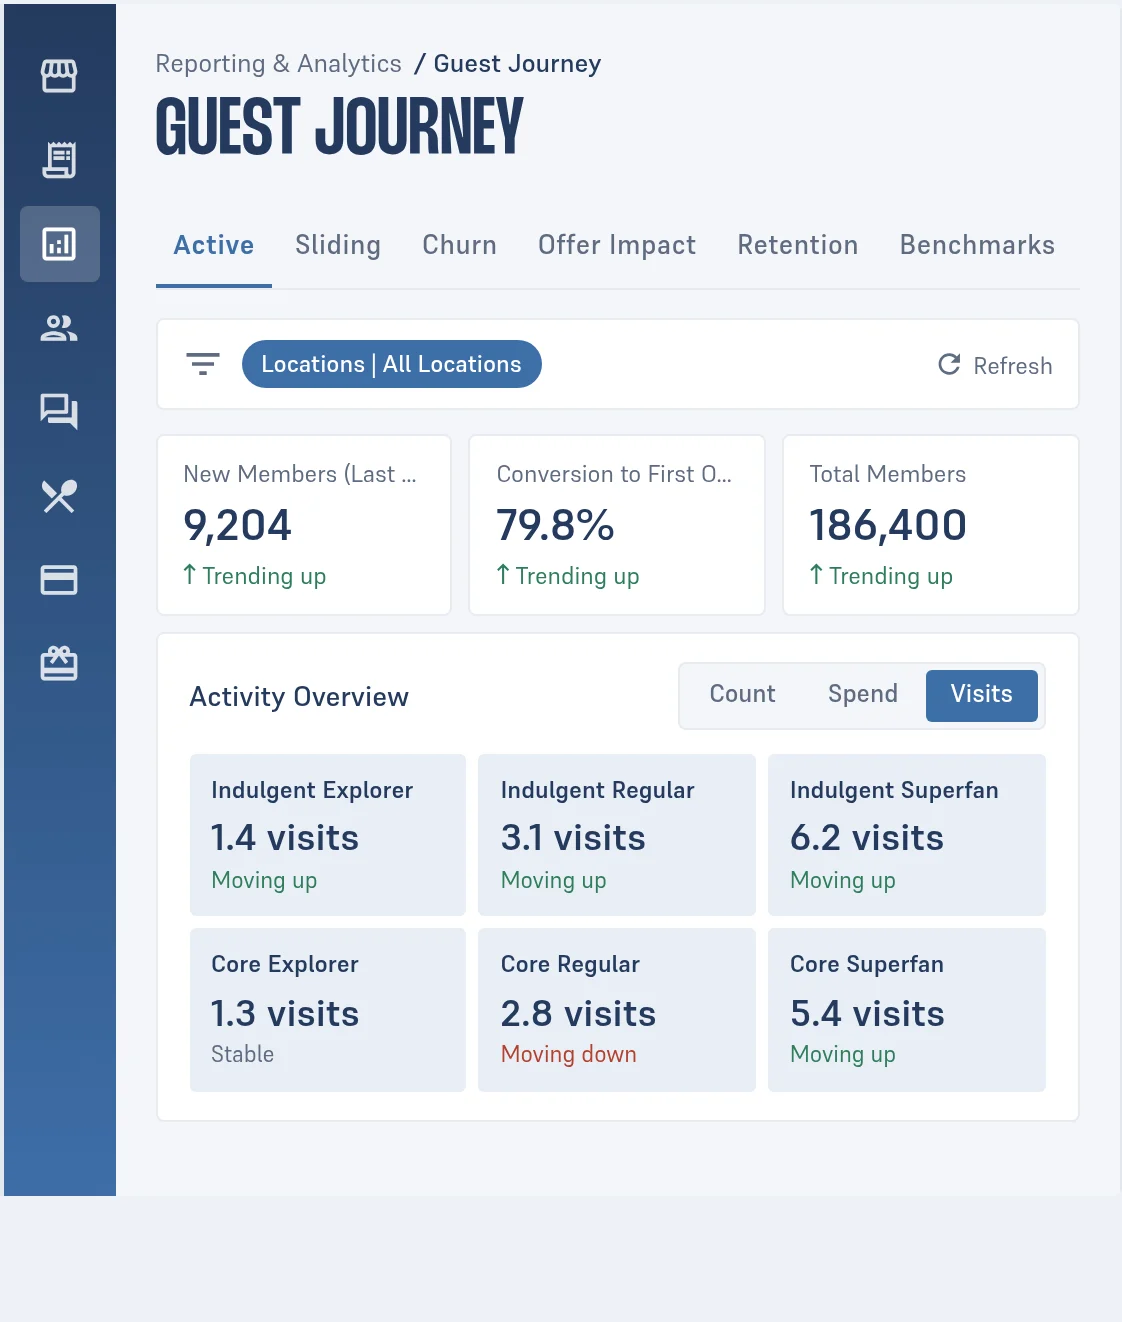
You have members.You have data.

But when someone asks whether loyalty is working, most teams have no quick answer, just scattered numbers.

Connected ReportsSix reports, brand-wide down to a single offer.
Location BenchmarksCompare any location to your brand average.
Goal TrackingSet a target on any trend and track progress.
Offer ProfitabilitySee which offers earn their keep, not just get used.
Export and AIClean data, built to pair with AI tools.

Six Reports, One Story

Numbers show what happened. These show what it means and where to act next.

  • Track growth, revenue share, and repeat visits
  • Compare franchisee and location performance
  • See which offers work and which fade

See Where Every Location Stands

A number alone says little. Benchmarks show whether it's good or bad.

  • Activity and contribution compared to your brand average
  • Spot the location breaking from the pattern
  • Know if a location is leading, or just looks fine alone

Set a Target, Don't Just Look at a Chart

A trend line shows where things stand today. A target turns it into something you're working toward.

  • Set a goal on any location's trend
  • Track progress against that goal over time
  • Turn a report into a plan

Know What an Offer Really Earns

Busy offers can still lose money. See what each one earns after the discount.

  • Redemptions, discount cost, and average check, side by side
  • Spot offers that get used but don't earn their keep
  • Every field comes with a clear definition

Your Data, Ready for What's Next

Every answer raises a new question. Export any number and answer it yourself.

  • Export any report as structured data
  • Drop it into the AI tools your team uses
  • Get answers without waiting on an analyst

Frequently
Asked Questions

Brand-wide numbers are limited to admins with full brand access. Anyone else sees only their permitted locations.

Yes. Filter by date range, compare to a prior period, and view by day, week, or month, depending on the report.

This compares a location against your own brand's other locations. Guest Journey's benchmarks compare your whole brand against similar restaurant concepts.

No. It's built to be read and acted on without one.

Signed-in members only. Guest checkout activity isn't included in offer performance reporting.
Know What Loyalty
Is Earning You.

Six connected reports, one straight answer.

Book a Demo